Lecture 3: Descriptive Statistics – Mean, Median, and Variance
1. Introduction to Measures of Central Tendency
Mean (Average):
-
Definition: The sum of all values divided by the number of values.
-
Formula:
Real-Life Example: Average test scores of students in a class. If students scored 70, 75, 80, and 85:
Median:
-
Definition: The middle value when all data points are arranged in order.
-
Use: More resistant to outliers than the mean.
Examples:
- For the dataset , the median is .
- For the dataset , the median is .
2. Introduction to Variability Measures
Variance:
-
Definition: The average of the squared differences from the Mean.
-
Formula:
Standard Deviation:
-
Definition: The square root of variance. Gives spread in same units as the data.
-
Formula:
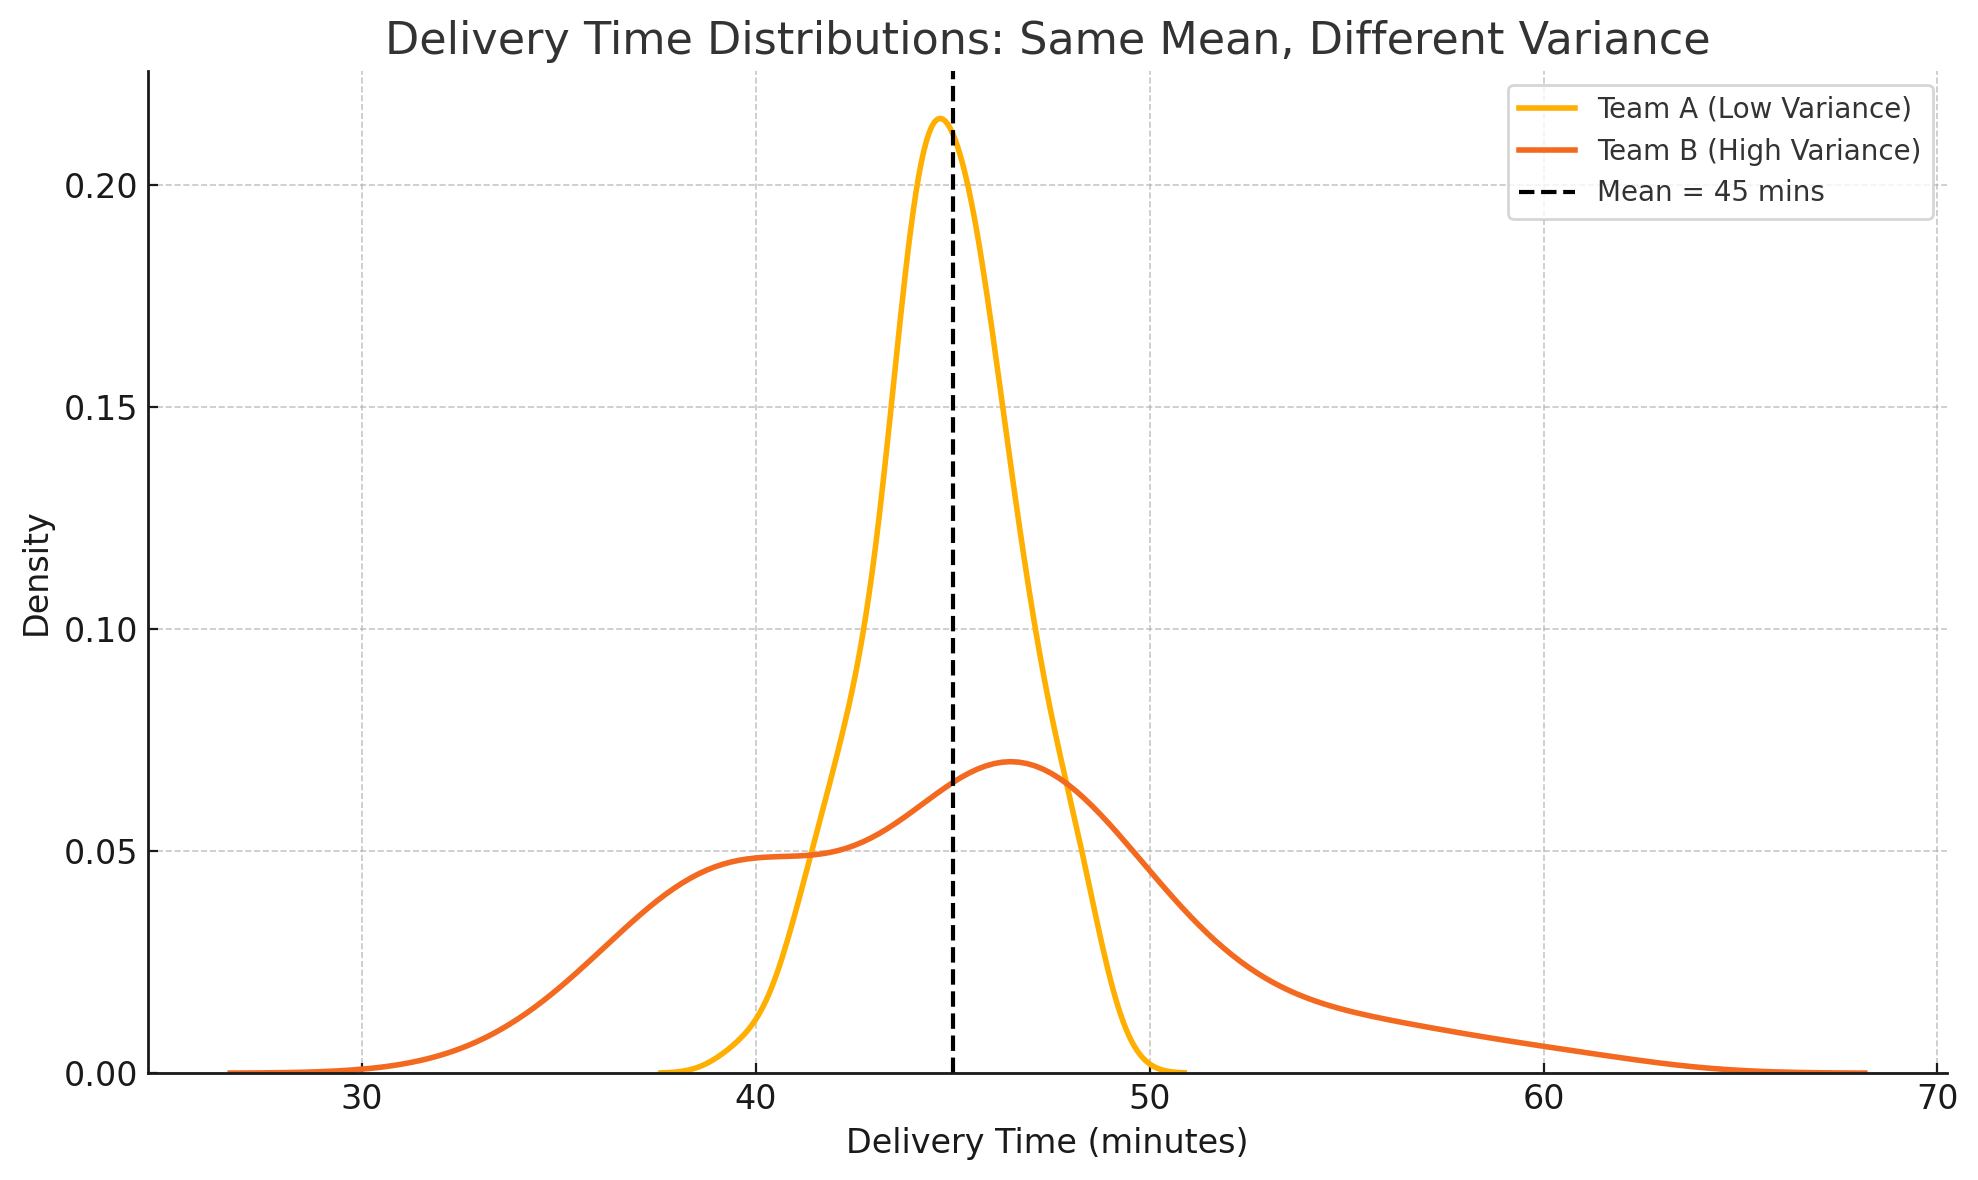
Real-Life Example: Consistency of delivery times for a courier company. Two delivery teams may have the same mean time, but very different consistency (standard deviation).
3. Why Do These Measures Matter in Real Life?
-
Mean: Good for general performance (e.g., GPA, batting averages).
-
Median: Crucial when data has outliers (e.g., housing prices, income).
-
Variance/Standard Deviation: Important for risk (e.g., in finance, customer service times, quality control in manufacturing).
4. Visualizing Probability Distributions with Different Variances
We'll plot normal distributions with:
-
Same mean
-
Increasing variance
This shows how data spreads more as variance increases.
Graph Sketches:
-
Distribution A:
-
Distribution B:
-
Distribution C:

Exercises
1. Outlier Impact Analysis
You are given two datasets:
- Dataset A:
- Dataset B:
Tasks:
- a) Compute the mean and median for both datasets.
- b) Discuss how the outlier (100) in Dataset B affects both measures.
- c) Which measure (mean or median) better represents the "typical" value?
Solution
a) Calculate mean and median for both datasets:
Dataset A: [10, 12, 13, 15, 15, 16]
Mean = (10 + 12 + 13 + 15 + 15 + 16) / 6 = 81 / 6 = 13.5
Median = average of middle two values (13 and 15) = (13 + 15) / 2 = 14Dataset B: [10, 12, 13, 15, 15, 100]
Mean = (10 + 12 + 13 + 15 + 15 + 100) / 6 = 165 / 6 = 27.5
Median = (13 + 15) / 2 = 14 (same as Dataset A)b) The outlier (100) greatly increases the mean from 13.5 to 27.5, but does not affect the median.
c) The median better represents the "typical" value here because it is resistant to outliers, unlike the mean which is pulled up by the extreme value.
2. Comparing Two Schools
School X and School Y both claim to have "the same average SAT score." Their score distributions are:
-
School X:
-
School Y:
-
a) Compute the mean and standard deviation for both schools.
-
b) Which school is more "consistent" in student performance?
Solution
a) Calculate mean and standard deviation (SD) for both schools:
School X: [1200, 1210, 1220, 1180, 1190]
Mean = (1200 + 1210 + 1220 + 1180 + 1190) / 5 = 6000 / 5 = 1200
Variance = / 5
= (0 + 100 + 400 + 400 + 100) / 5 = 1000 / 5 = 200
SD = sqrt(200) ≈ 14.14School Y: [1000, 1050, 1200, 1350, 1400]
Mean = (1000 + 1050 + 1200 + 1350 + 1400) / 5 = 6000 / 5 = 1200
Variance = / 5
= (40000 + 22500 + 0 + 22500 + 40000) / 5 = 125000 / 5 = 25000
SD = sqrt(25000) = 158.11b) School X is more consistent because it has a much smaller standard deviation (~14.14) compared to School Y (~158.11).
3. Mean vs Median
Suppose that the average income in a city is 10,000 Riyals, and the median income is 5,000 Riyals.
What can you say about the distribution of income in this city? More people are richer or poorer than the average?
Solution
The mean income (10,000 Riyals) is much higher than the median income (5,000 Riyals).
This suggests the income distribution is right-skewed, meaning that a few people earn much more than most others.
Because the mean is pulled upward by these high incomes, more people actually earn less than the average (mean).
4. Reverse Engineering a Dataset
You are told that a dataset of 5 numbers has:
- Mean = 10
- Median = 8
- Standard deviation ≈ 4
Tasks:
- a) Find at least one possible dataset that fits this description.
- b) Can you find a second dataset that fits the criteria but looks very different?
- c) What does this tell you about the uniqueness of statistical summaries?
Solution
Given mean = 10, median = 8, SD ≈ 4, and 5 numbers in the dataset:a) One possible dataset: [5, 7, 8, 14, 16]
- Mean = (5 + 7 + 8 + 14 + 16) / 5 = 50 / 5 = 10
- Median = 8 (middle value when sorted)
- SD (approximate) close to 4
b) Another dataset: [6, 6, 8, 12, 18]
- Mean = 10, median = 8, SD ≈ 4 as well
c) This shows that statistical summaries like mean, median, and standard deviation are not unique and many different datasets can have the same summary statistics but very different values.
Additional Advanced Exercises
1. Predicting the Effect of a Data Shift
Suppose a dataset has:
- Mean = 100
- Median = 95
- SD = 15
If each value in the dataset is multiplied by 2 and then 10 is added, what happens to:
- The mean?
- The median?
- The standard deviation?
Follow-up Challenge: Generalize a rule for what happens to mean, median, and standard deviation under:
- Additive transformations (e.g. )
- Multiplicative transformations (e.g. )
2. Prove or Disprove: The Mean is Always Closer to the Data
Statement: "The mean of a dataset is always closer to the data points than the median."
Task:
- Prove this is always true, OR
- Find a counterexample.