Lab 1: Probability and Statistics
Problem 1: Ten Coin Tosses
You have access to an online coin-flip simulator (just Google “coin flip”). Follow the steps below:
-
One Run
- Toss the coin 10 times.
- Record how many heads you get.
-
Repeat
- Perform the 10-toss experiment 3 more times (4 runs total).
- Record the number of heads in each run. You should have 4 numbers.
-
Report
- Report the number of heads in each run to the board.
-
Compute the Average
- Let be the number of heads in run .
- Calculate
-
Predict
- Before checking your work, guess what value will be.
- After you compute it, compare to your guess.
-
Theory Check
- Without doing more flips, what would you expect the number of heads to be in 10 tosses of a fair coin?
- How close was your to that number?
-
Explore Further
- Try 10 runs of 10 tosses. How does the average change?
- You can do this by performing the 10-toss experiment 6 more times and average the new numbers with the previous 4.
- Make a brief note: when you increased the number of runs, what happened to your average?
So What Should You Expect?
In your experiment above, you tossed a coin 10 times per run, and recorded the number of heads. You did this multiple times and averaged the results.
You probably noticed something interesting:
- The number of heads changed from run to run.
- But the average started to settle around a specific number as you did more runs.
Let’s take a step back:
Is there a way to predict that average value using math, even without running the experiment?
In probability, the expected value (or expectation) is a way to predict what will happen on average over many repeated trials.
It tells you the average outcome you’d get if you repeated an experiment forever.
In the case of coin flips, it helps answer:
"How many heads should I expect in 10 tosses of a fair coin?"
Expectation Formula
If a random variable can take values with probabilities , the expected value of ( X ) is:
This means:
Multiply each outcome by its probability, then add them up.
Applying It to Coin Tosses
Each coin toss has:
- A 50% chance of heads (value = 1)
- A 50% chance of tails (value = 0)
So the expected value for one toss is:
That means:
On average, you get half a head per toss.
So for 10 tosses:
Why It Matters
Expectation helps you:
- Predict long-term outcomes
- Compare strategies in games and simulations
- Build models in statistics and computer science
Check Your Results
- Look back at your . How close was it to 5?
- Did averaging over more trials bring you closer to the expected value?
- Can you explain why?
Problem 2: What Does a Positive Test Really Mean?
You Get Tested for a Rare Disease
Imagine there’s a disease that is not very common — it affects 1 out of every 200 people.
There’s a test for the disease that is:
- 95% accurate if you do have the disease (it gives a positive result 95% of the time).
- 90% accurate if you don’t have the disease (it gives a negative result 90% of the time).
You go to the clinic and take the test.
A few days later… the result comes back: positive.
What Do You Think?
Does this mean you almost certainly have the disease?
Is your chance of being sick close to 95%?
It’s tempting to think so — after all, the test is 95% accurate!
But let’s dig deeper.
Let’s Think About It Another Way
Imagine 20,000 people get tested.
- How many of them actually have the disease?
- How many will test positive because they’re sick?
- How many will test positive even though they’re not sick?
- Out of all the people who tested positive, how many are truly sick?
Hints:
- Use the fact that 1 in 200 people have the disease to figure out how many sick people there are.
- Apply the test accuracy to calculate how many of them will test positive.
- Use the 90% accuracy for healthy people to figure out how many false positives happen.
- Add all the positive results, and compute what fraction are actually sick.
What You’ll Discover
You might be surprised!
Even though the test is pretty good, your actual chance of having the disease — given a positive test result — is probably much lower than 95%.
Bayes’ Theorem: The General Tool
Once you’ve figured it out using numbers, there's a general formula that works for all situations like this — where you get new evidence and want to update your belief.
It's called Bayes’ Theorem.
This formula helps you:
- Combine how rare or common something is (base rate)
- With how accurate the evidence is (likelihood)
- To get the updated probability that you care about
Takeaway
Bayes’ Theorem tells us how to revise probabilities when we get new information.
It shows that even accurate tests can lead to misleading conclusions when the thing you're testing for is rare.
Problem 3: Random Monster in the Woods!
You are exploring a dark forest. At every step, there is a chance you'll encounter one of three monsters, each equally likely.
Each monster deals a random integer amount of damage to you when it attacks, according to a uniform distribution:
| Monster | Behavior | Damage Range | Damage Type |
|---|---|---|---|
| Timid | Cautious | 1 to 6 | Uniform |
| Aggressive | Reckless | 1 to 12 | Uniform |
| Deadly | Lethal | 1 to 20 | Uniform |
Each time you encounter a monster, one is chosen at random (with equal probability). You don't know which monster it is until you're hit.
Part 1: Expected Damage from a Random Monster
Question:
What is the expected amount of damage you would take from a single monster encounter?
Hint:
- Start by computing the expected value of an integer uniform distribution on:
- 1 to 6
- 1 to 12
- 1 to 20
- Then, average those values using the fact that each monster appears with equal probability.
Part 2: What if You Were Hit for 15?
You are hit for exactly 15 damage.
You still don’t know which monster it is — but now you can narrow it down.
Question:
Based on this hit, what is the most likely monster, and what is your new expected damage?
Hint:
- Which monsters are capable of dealing 15 damage?
- What is the expected damage from the remaining monster(s)?
Part 3: What if You Were Hit for 4?
Now, you are hit for 4 damage.
Question:
Given this information, what is your updated expected damage?
Hint:
- All three monsters could have caused this hit — but with different likelihoods.
- For each monster:
- What is the probability that it would deal exactly 4 damage?
- Combine that with the chance of encountering that monster to estimate how likely it is that each monster hit you.
- Use those weights to find a new expected damage.
Problem 4: Project Completion Time with Triangular Distribution
A small engineering team estimates that a certain project task will take at least 4 days, most likely 7 days, and at most 12 days to complete. They model the completion time using a triangular distribution on the interval with peak at . Its probability density function is given by:
and its plot is shown below (notice that the area under the curve is 1):
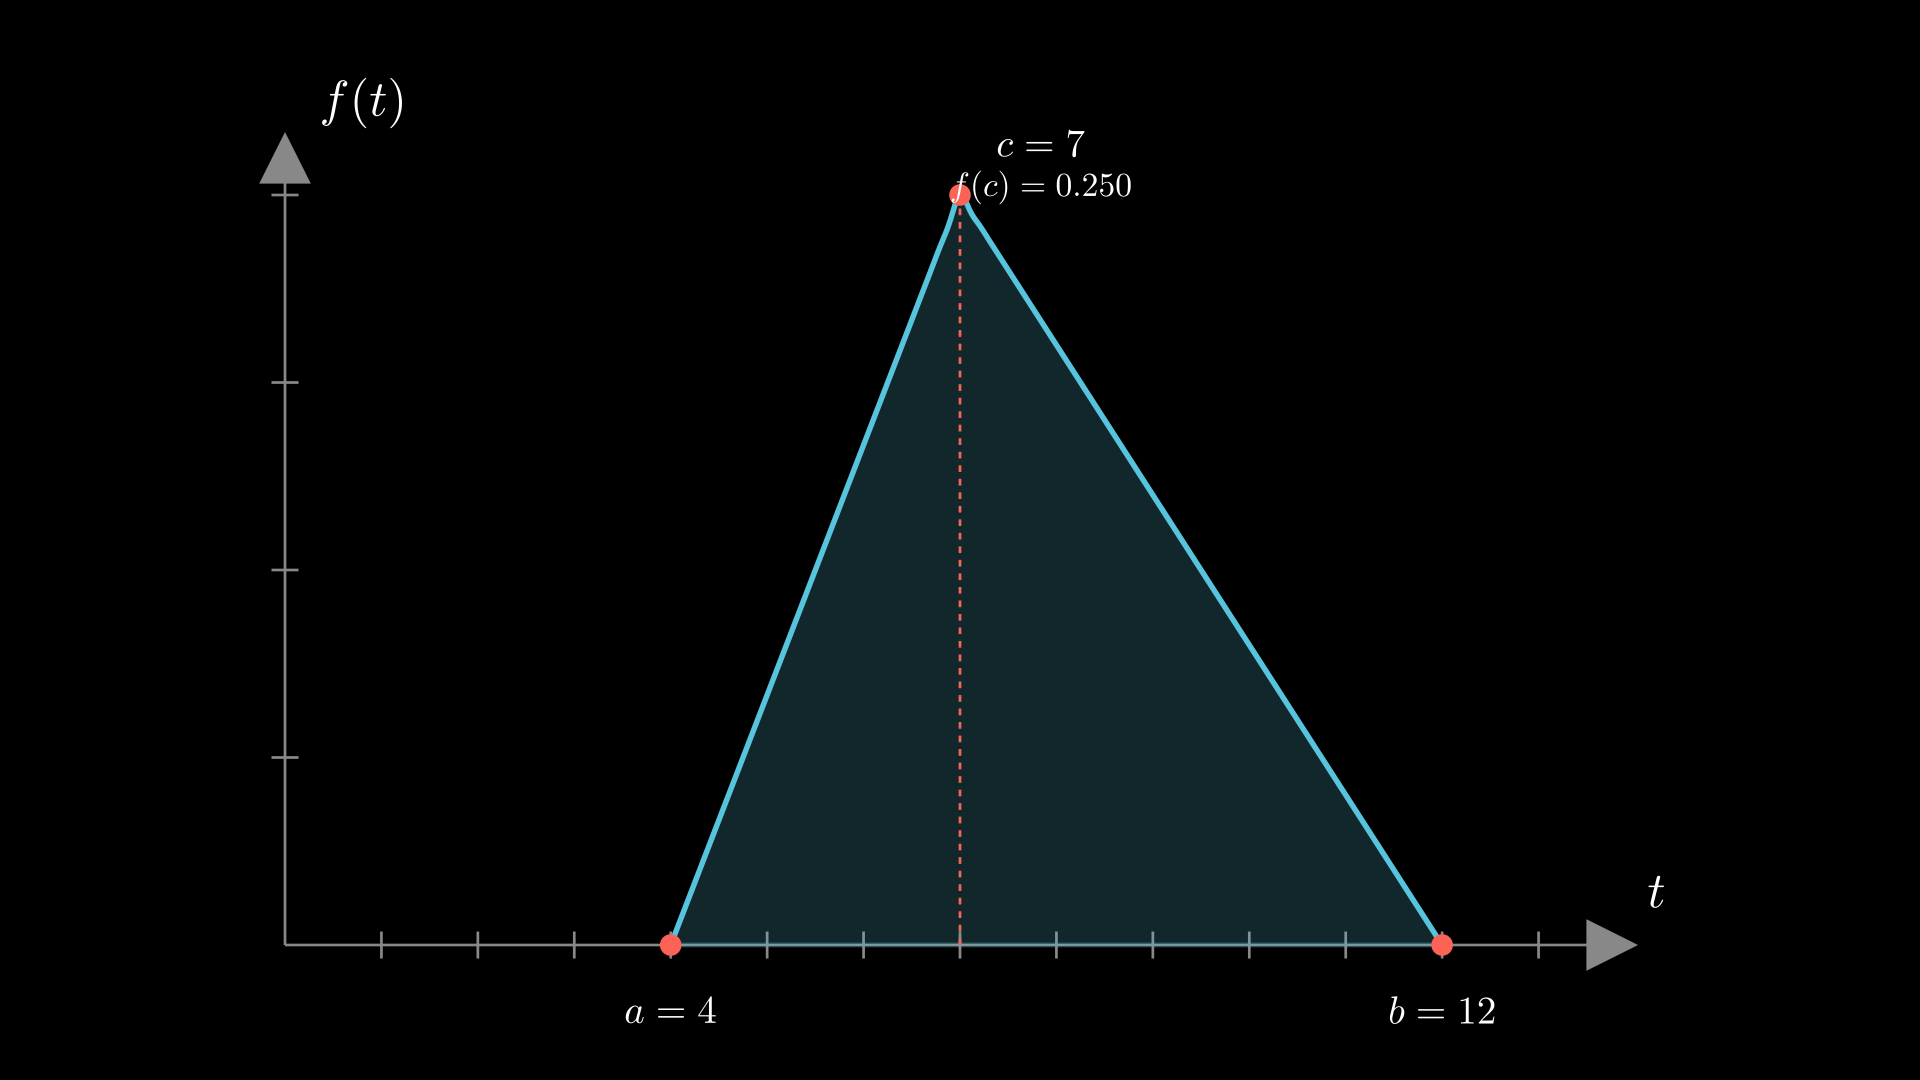
- What is the probability that the task will take more than 8 days to complete?
- What is the probability that the task will take between 5 and 9 days to complete?
- The team needs a 90% confidence that the task finishes by a certain day . Find such that .
Your Feedback!
Please fill the following Google form to provide feedback on the first week:
Extra Problem: # Should You Switch?A Monty Hall Mystery
The Game Show:
You’re on a game show! In front of you are 4 closed doors. Behind one door is a shiny car, and behind the other three are goats .
Here’s how the game works:
- You choose one door (say, Door 1).
- The host, who knows what’s behind every door, opens two other doors — and both have goats.
- You are now left with:
- Your original choice (Door 1)
- One unopened door (say, Door 3)
The host says:
“Would you like to stay with your first pick or switch to the other unopened door?”
What’s Your Strategy?
- Would you stay or switch?
- Do you think it’s a 50/50 chance now?
Many people say:
“There are only two doors left — it must be even odds!”
But what if it’s not?
Let’s Think It Through
Imagine playing this game many times. Suppose you always choose Door 1.
Question 1:
What’s the chance that you picked the car on your first try?
Question 2:
If you didn’t pick the car, where is it?
Now the host opens two goat doors from those three.
Important: The host always opens goat doors. He never reveals the car.
Question 3:
If your original choice was wrong, what happens to the car's location?
- Can the host open the door hiding the car?
- Where must the car end up, from your point of view?
Try This Experiment
Play a few rounds with a friend:
- Place 1 car and 3 goats under 4 cups or cards.
- Randomly choose one.
- Let your friend (the host) peek and reveal 2 goats from the remaining 3.
- Decide whether to stay or switch.
- Track your wins over many rounds.
Do you win more often when you switch?
Reflection: What Did You Discover?
- Did your first pick usually have the car?
- How often did switching win?
- Why might the remaining unopened door have a better chance than it seems?
Key Idea
Even though only two doors remain, the odds are not 50/50.
Your original choice only had a 1 in 4 chance.
The host’s action gives you extra information.
But we’ll hold off on the full answer for now — you might already have a good guess!
Try explaining your reasoning to a friend.
Why might switching win more than 50% of the time?
Additional Resources
If you are interested in additional practice with probability and statistics, you can check out the following resources: